Whether you are experienced in investing in growth stocks, or just learning how to read stock charts, it’s clear that the better information and more tools you have available, the better your chances of success. Continue reading “Learning Article : How Relative Strength Rating Helps You Pick Outstanding Growth Stocks”
Learning Article : Why the Relative Strength Line/Rating Holds a Big Clue
“Relative price performance is a good way to tell which of the five or six stocks you own is your true leader. If you’re going to do any selling, it’s normally correct to weed the flower patch by selling your worst-performing stocks first.” – William J. O’Neil Continue reading “Learning Article : Why the Relative Strength Line/Rating Holds a Big Clue”
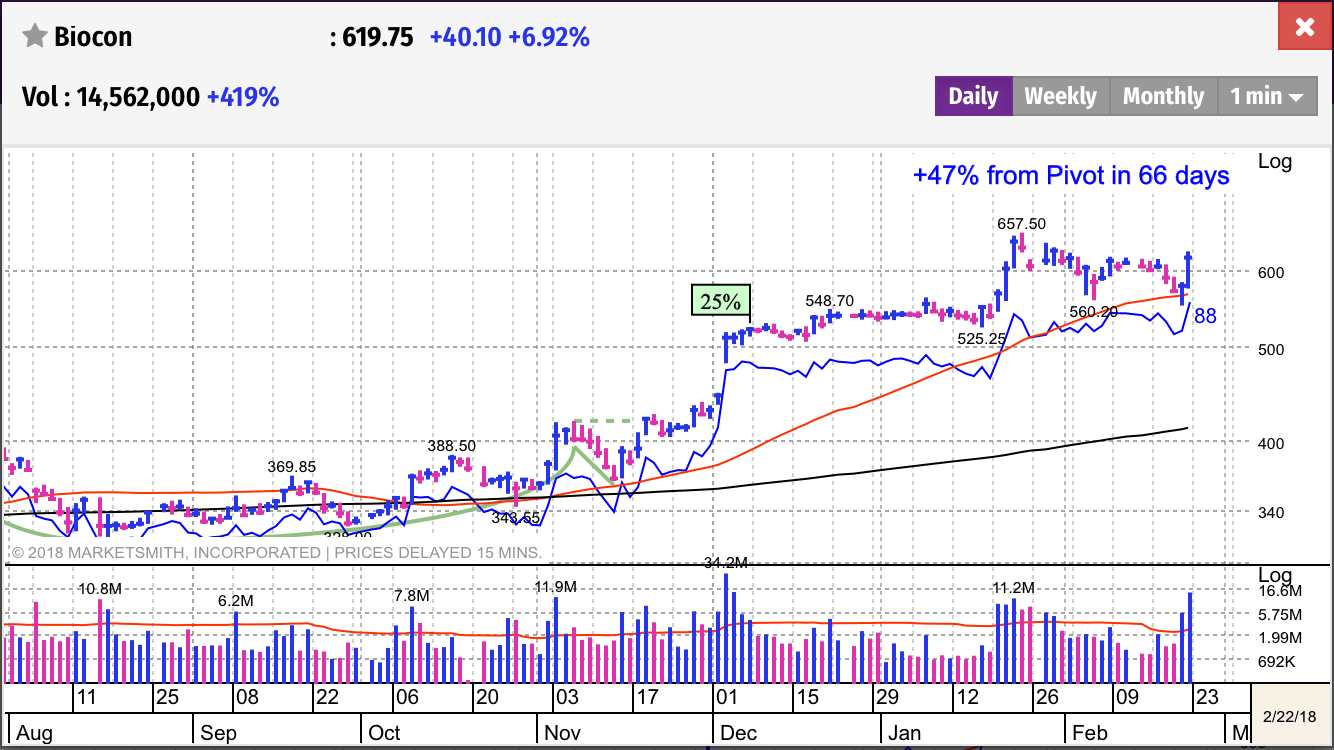
Chart Of The Day – Biocon Finds Strong Support at 50-DMA
Biocon jumped almost 7% in today’s session, driven by strong buying interest. The stock found strong support just above its 50-day line and rebounded sharply in today’s session. It closed 5.7% below its 52-week high of 657.5 and has strong technical ratings, with Accumulation/Distribution rating at A+ and Relative Strength rating at 88.
How to Interpret Relative Strength Line?

Investor Query: How to interpret the relative strength line on the charts?