

In India, most moviegoers must have a bag of popcorn while watching films. In growth stocks, what is the one thing you must have for an outstanding breakout?
Volume. Lots of it.
If the amount of shares traded on breakout day, or a few days afterward, surges well above normal levels, your confidence in the stock should grow. As a stock bolts out of a good cup-with-handle or any other type of base, heavy turnover means this: The big guns on the Dalal Street are accumulating shares big time. They are willing to pay up.
So, what are “normal volume levels?”
MarketSmith India calculates a 50-day average daily share volume and plots it as a thin red line on daily charts. So you can quickly see if the volume was heavy, flat, or light on any trading day. Just compare the height of the volume bar for that day with the 50-day line itself.
At www.marketsmithindia.com, open up a daily chart and click on any price-and-volume bar. A pop-up data box shows the volume that day and how it compares with average volume. Ideally, volume on the breakout day should be at least 40% above the 50-day average. For small and midcap stocks, the volume might double, triple, or even quadruple.
Big Breakout, Muthoot-Style
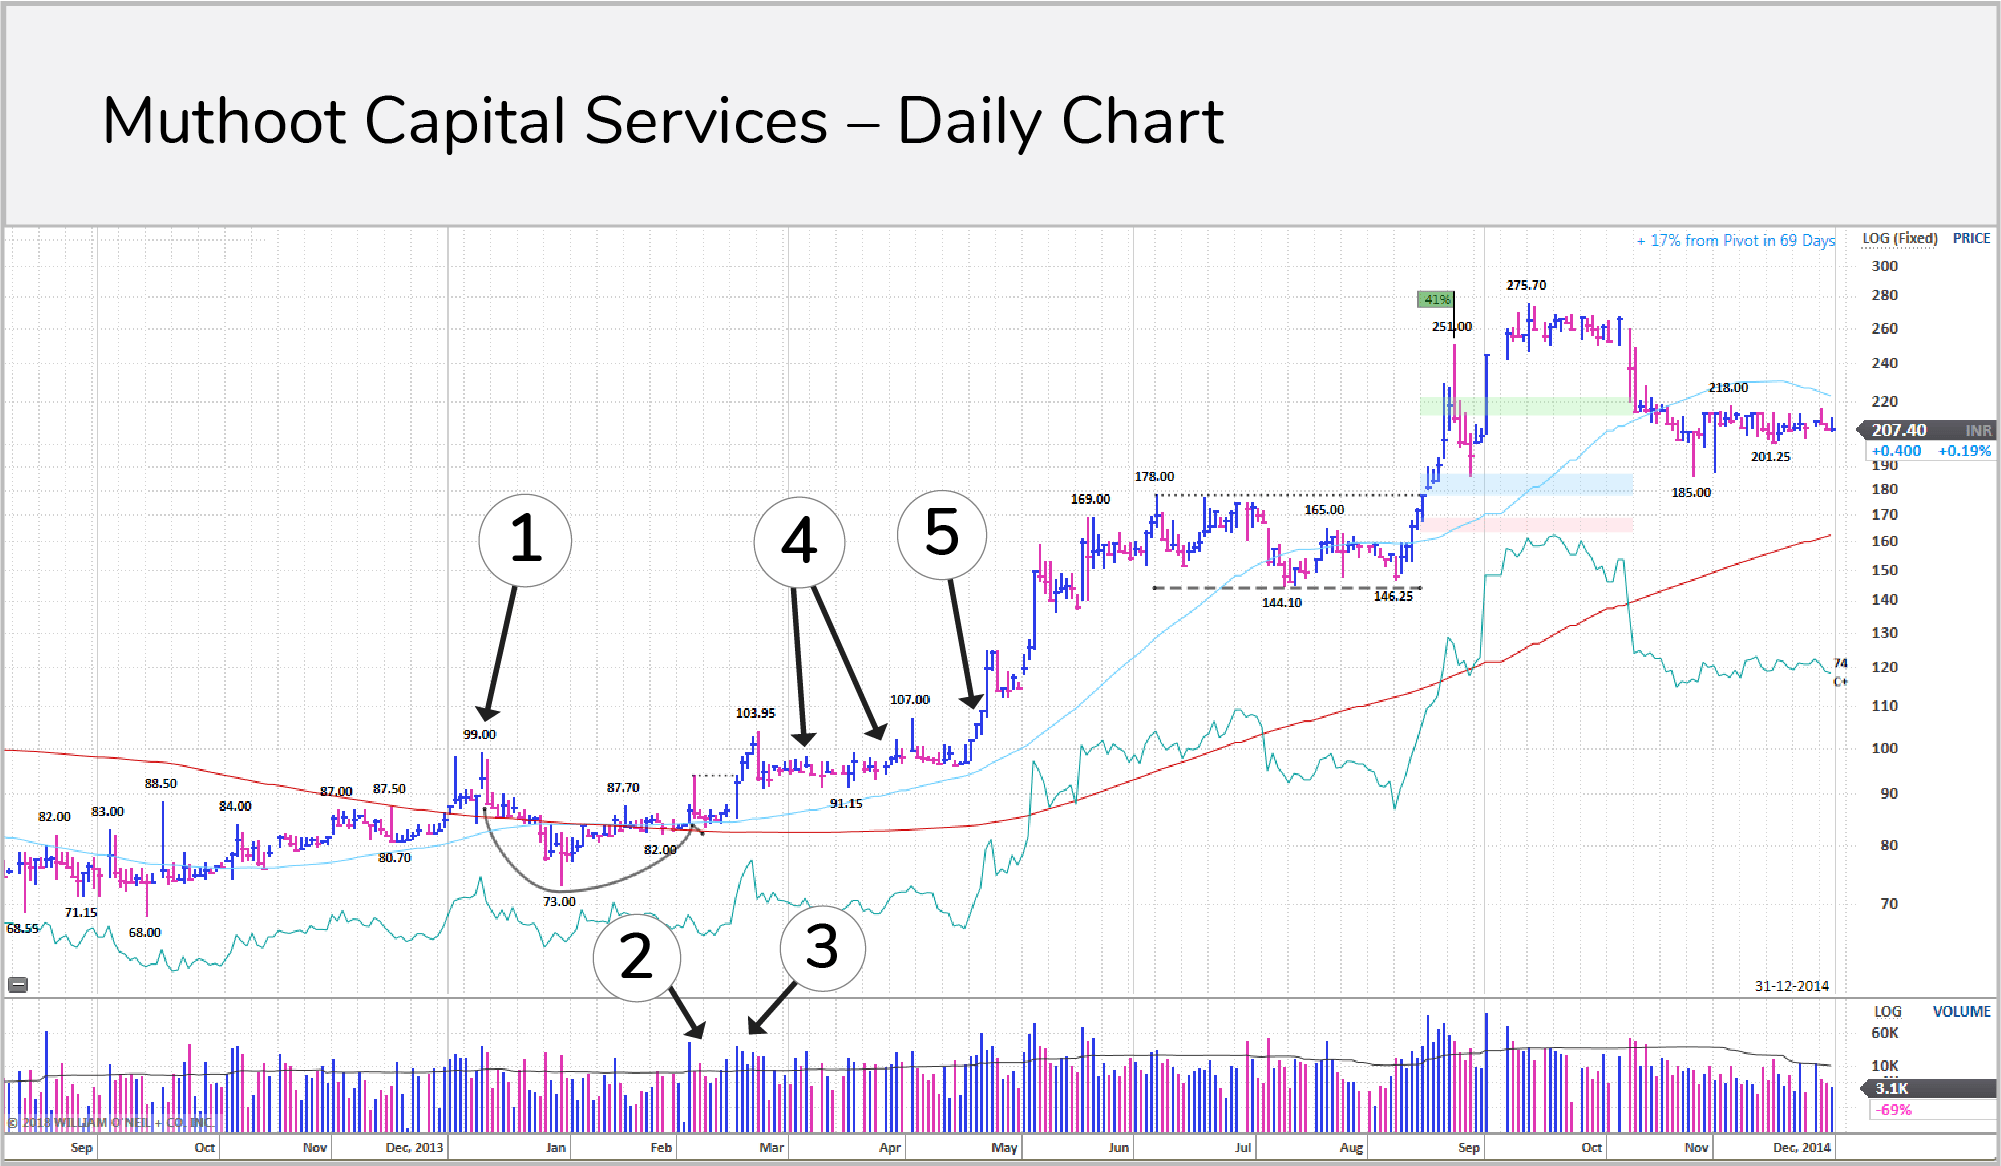
Muthoot Capital Services flashed a picture-perfect breakout on March 19, 2014.
After peaking on January 9, 2014, at 99 (1), the non-banking financial player cooled off for 10 weeks, hitting a bottom at 73 on January 30. The 26% drop from head to toe was deep and it forced a shakeout of weak investors from the stock.
As the stock came back to reclaim its previous high, notice the big volume up days formed the cup’s right side. The handle was not very long, but it showed a dry-up in volume in down sessions (2). Also, note how the stock found bullish support along the 50-DMA.
Muthoot rallied 4.6% on March 19 and rolled past the ideal buy point of Rs 94. See how the volume bar soared well above the 50-day average (3). Mutual funds, banks, pension funds and the like furiously snatched shares. Trading volume soared 186% above its average 7.8K shares to 22.4K on that day.
Following the breakout, the stock stayed sideways for few sessions (4) before launching into new highs in late May 2014 (5). The stock went on to almost triple in price in the next seven months. The stock never fell more than 8% from its ideal buy point of 94 and traded convincingly above its 50-day line until August 2014.
To Read Detailed Reports including Stock Recommendations, Idea Lists, Evaluate Stocks etc. Subscribe to MarketSmith India.